How is virtual desktop performance monitored?
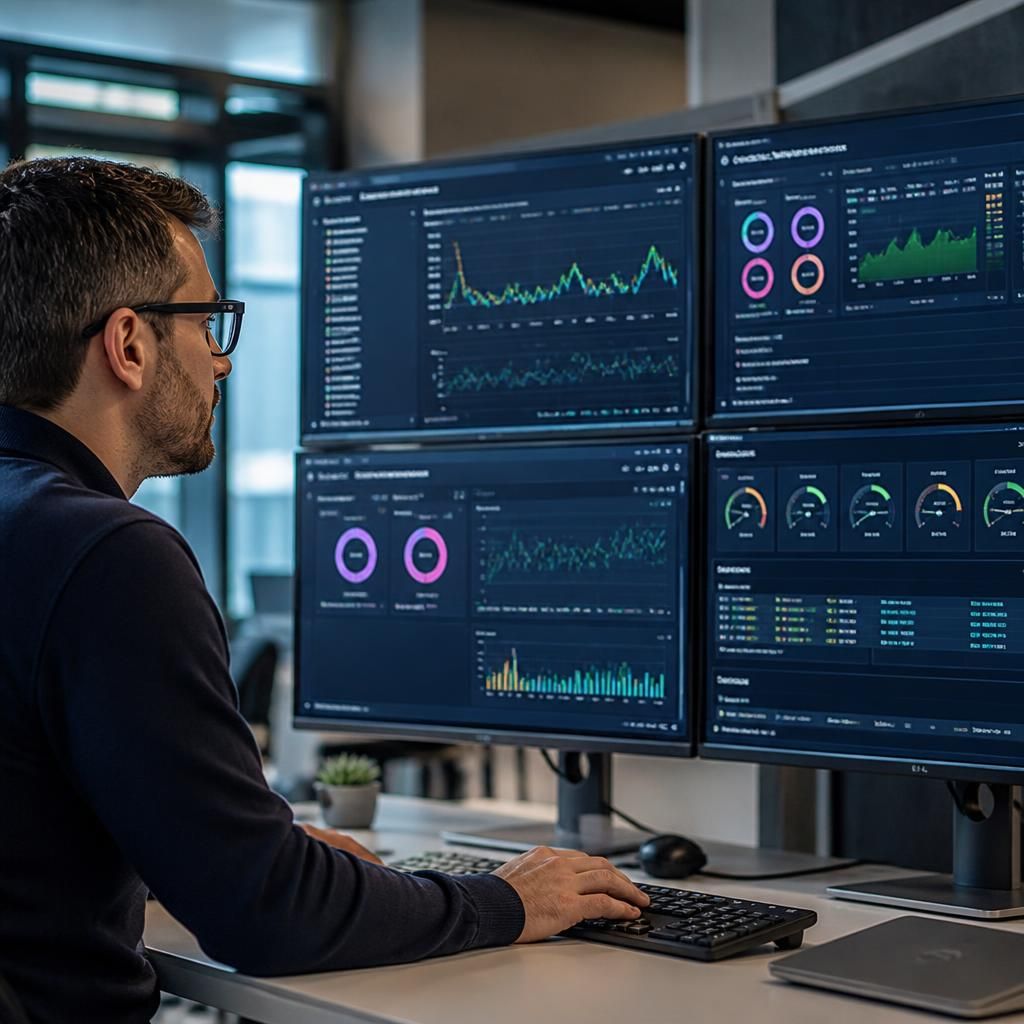
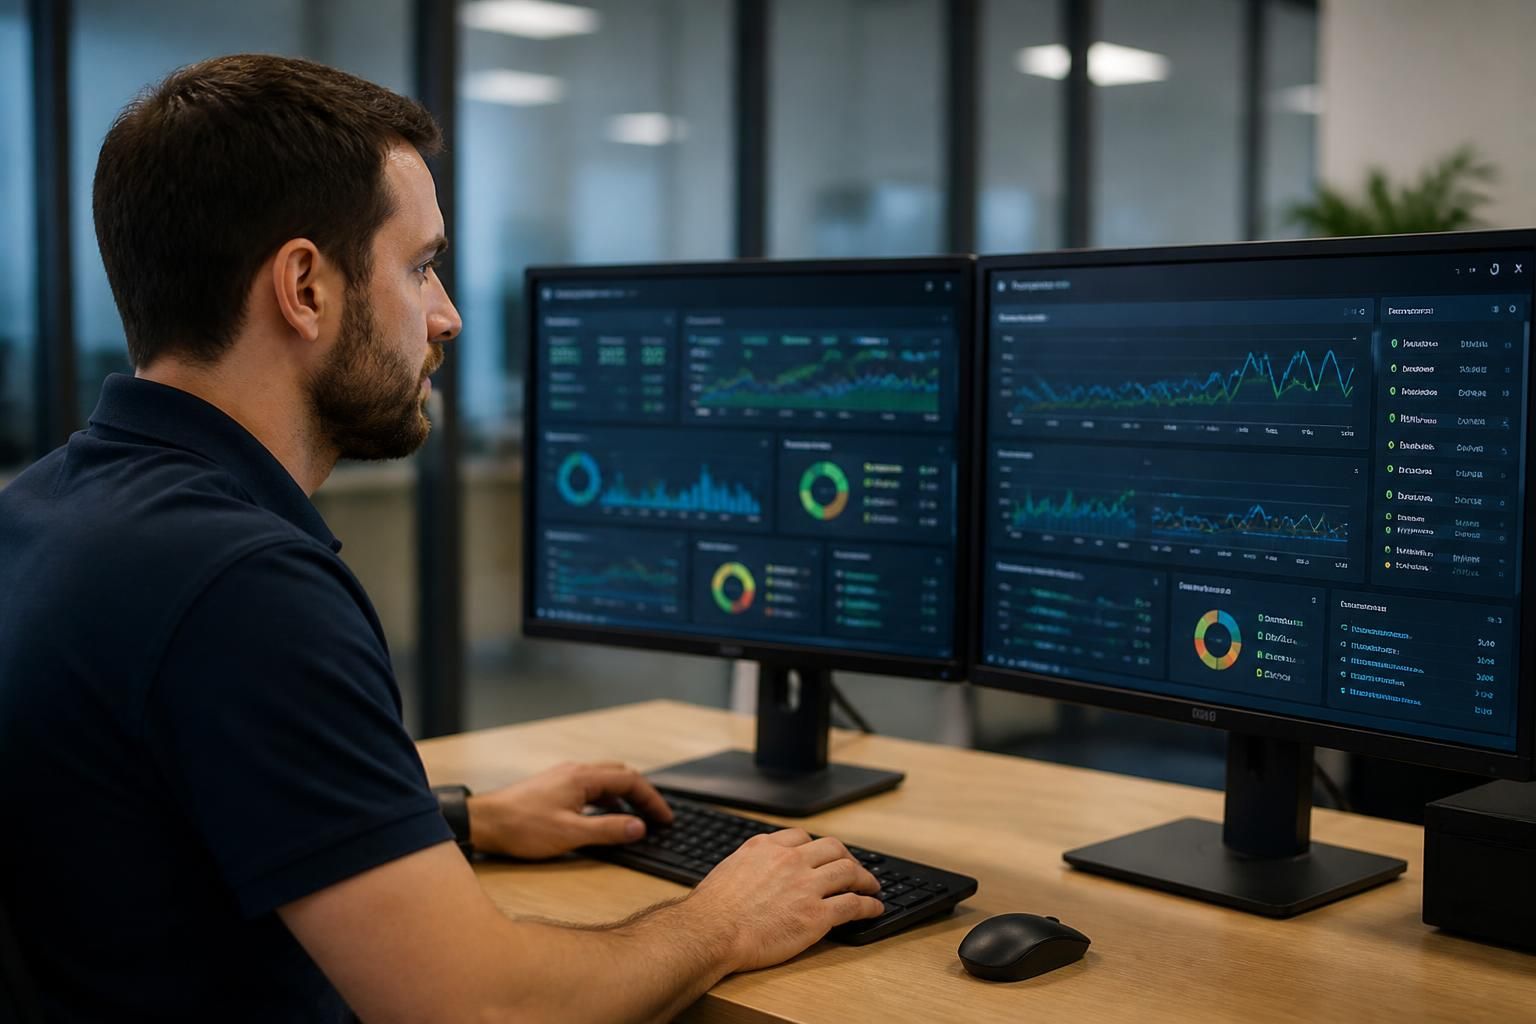
Virtual desktop performance is monitored by tracking infrastructure health and the user experience, including session responsiveness, login times, latency, resource utilisation, application performance and service availability. Monitoring tools generate alerts when unusual behaviour or capacity pressures emerge, allowing issues to be investigated before they significantly affect users.
Virtual desktop performance is monitored through a combination of platform telemetry, automated checks, user-impact indicators and regular review. The aim is not simply to confirm that the service is running, but to identify whether the environment is delivering a consistent working experience and to establish the likely cause when performance deteriorates.
Monitoring takes place at several layers:
- Virtualisation platform: The monitoring system checks the health of the hosts, virtual machines, connection brokers, storage and network services that make desktop sessions available.
- Operating system: Windows events, background processes, driver issues and failed services can reveal problems that are not visible from the underlying platform alone.
- Applications: Important business applications can be checked for launch failures, crashes, errors and unusual processing delays. This helps distinguish a desktop problem from an issue within a particular application.
- Connection path: The route between the user, access gateway and hosted desktop is assessed for instability, packet loss and interruptions. A healthy data centre cannot compensate for a poor connection between the user and the service.
Baseline comparison is central to useful monitoring. A monitoring platform records what normal operation looks like for the organisation, including typical working patterns and the resources used by different desktop groups. New readings are then compared with that baseline rather than judged against a generic threshold. This reduces unnecessary alerts and makes gradual changes, such as increasing demand after a software deployment, easier to identify.
Monitoring can also use synthetic transactions. These are automated checks that imitate a basic user journey, such as establishing a session, opening a permitted application and completing a simple task. Synthetic testing can identify a problem before a user reports it, particularly where a service is technically available but a key function is failing.
Effective monitoring combines alerts with diagnosis. An alert should provide enough context to support investigation, including the affected desktop pool or service, when the change began, whether other components changed at the same time and which users or sites may be affected. Related alerts should be grouped where possible, because one underlying fault can otherwise produce a large number of separate notifications.
Performance data is often correlated with change records. If an issue begins after a configuration change, operating system update, application release or capacity adjustment, that relationship can help narrow the investigation. Monitoring should support a sequence of actions: validate the alert, identify the affected layer, assess the business impact, apply an appropriate remedy and confirm that normal behaviour has returned.
Capacity monitoring supports forward planning. Historical trends can show whether a desktop pool, storage tier or network service is approaching a point where additional resources or design changes may be needed. This is different from reacting to a fault after users are affected. Capacity reviews should consider expected staff growth, new applications, larger files, changes in working practices and the requirements of different user groups.
Performance monitoring also needs sensible access controls. Telemetry may contain usernames, device details, application names or other information about how a service is used. Access to monitoring consoles and reports should therefore be restricted, retained appropriately and handled in line with the organisation’s security and data protection requirements. The objective is to diagnose service quality without collecting unnecessary personal information.
For a small business, a practical monitoring arrangement should define which services are important, what constitutes abnormal behaviour, who receives alerts, how incidents are recorded and how often trends are reviewed. A managed IT provider can help translate technical readings into business-relevant findings, recommend adjustments and ensure that monitoring remains aligned with the organisation’s applications, users and working practices.
Virtual desktop performance is best assessed by comparing results across relevant user groups, not just by reviewing an overall average. A single figure for the whole environment can hide a problem affecting one desktop pool, application, office location or type of device. Separating these views helps identify whether an issue is widespread or limited to a particular configuration.
Monitoring reports can therefore combine service-wide summaries with more focused comparisons, such as login behaviour for different desktop groups or application performance on different connection types. This makes performance data easier to interpret and helps technical teams investigate the part of the environment most likely to be responsible, rather than treating every user report as the same problem.
For business owners, useful reporting should explain the practical significance of the data. A report might show recurring patterns, affected services and changes that require attention, rather than presenting a dashboard of technical readings without context. This allows virtual desktop performance to be reviewed as an operational service and informs decisions about configuration, user requirements and future development.