How is cloud server performance measured for business applications?
Cloud server performance is measured by monitoring application response times, network latency, processing speed, resource use, uptime and reliability under normal and peak demand. These measures show whether business applications remain responsive, available and capable of handling changing workloads.
Cloud server performance is measured by comparing how consistently a business application delivers its required service against defined technical and business targets. The assessment should cover the complete application path, including the server, storage, database, network connection and dependencies, rather than judging the server from processor or memory use alone.
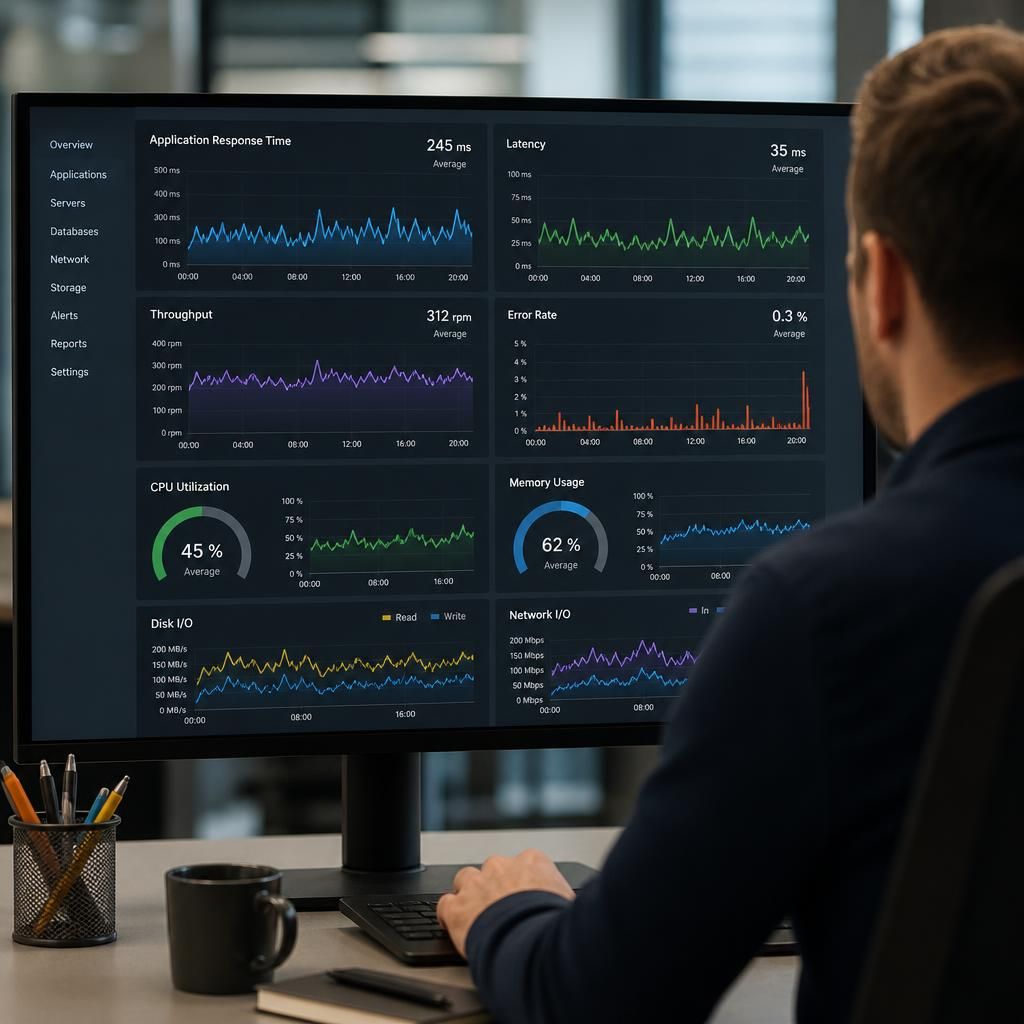
Application response time shows how long users or connected systems wait for an action to complete. Measurements may be taken for tasks such as signing in, opening a record, submitting an order, generating a report or saving a document. It is useful to examine typical results as well as slower transactions, because an average can conceal occasional delays that affect important workflows.
Latency and throughput help explain how the system behaves when data is transferred or processed. Latency is the delay before a request begins to receive a response, while throughput describes the volume of requests, transactions or data that can be handled over a period. Both should be assessed between the user location and the cloud environment, particularly where staff work from several sites or depend on remote access.
Resource performance is assessed by observing how the virtual server uses its allocated resources. Relevant indicators include:
- processor utilisation and the amount of processing capacity available;
- memory consumption, including whether insufficient memory causes additional disk activity;
- storage input and output speed, queueing and available capacity;
- network traffic, packet loss and connection errors; and
- database or application service activity that may be limiting the overall result.
These indicators need to be interpreted together. High processor use may indicate genuine demand, inefficient application code or an undersized server. Conversely, low processor use does not prove that an application is performing well if storage operations, database queries or network delays are creating the bottleneck.
Availability and reliability are measured through service records and monitoring data. This includes whether the application can be reached, whether key functions complete successfully and whether faults recur. Planned maintenance, infrastructure incidents and application errors should be recorded separately where possible, so that a business can distinguish a cloud platform issue from a problem within its own software or configuration.
Scalability testing examines whether performance remains suitable as demand changes. A provider or IT team may compare results at different workload levels, test additional concurrent users and assess how the environment behaves when resources are increased. This helps identify whether the application can scale vertically by adding capacity to a server, horizontally by distributing work across multiple instances, or not at all without software changes.
Testing should reflect real business activity rather than rely solely on synthetic benchmarks. A useful test plan can include:
- identifying the application functions and user journeys that matter most;
- recording baseline measurements during representative working conditions;
- testing expected busy periods and selected higher-demand scenarios;
- checking performance after configuration, software or infrastructure changes; and
- reviewing results against agreed thresholds and investigating exceptions.
Monitoring is most useful when it combines infrastructure data with application-level evidence. Server dashboards can show resource trends, but application performance monitoring can trace an individual transaction through web services, databases and external dependencies. Logs can then help establish whether a delay resulted from a failed query, an authentication service, a storage operation or a connectivity problem.
Performance should also be reviewed over time. A system may appear adequate when first deployed but become less suitable as databases grow, applications change, additional users are added or traffic patterns develop. Trend analysis can reveal gradual capacity constraints before they cause material disruption. It also supports decisions about right-sizing the cloud environment, changing storage arrangements, improving the network or optimising the application itself.
For a small or medium-sized business, the most meaningful performance measures are those linked to operational requirements. A report that generates reliably, a case-management system that remains usable, or a production application that processes transactions consistently may matter more than a single hardware benchmark. S2 Technology Group can help businesses assess these measurements as part of wider cloud server planning, ongoing IT management and infrastructure improvement.
Cloud server performance should be measured separately for each type of business workload, because an application can be suitable for one task and unsuitable for another. Interactive tasks such as opening customer records require consistent user-facing responsiveness, whereas overnight processing may be judged by whether a complete job finishes within its required processing window.
Useful measurements can therefore be grouped by workload: user transactions, scheduled jobs, integrations and background services. For each group, record the relevant completion time, failure rate and amount of work processed, then compare the results with the operational requirement. This prevents a short, infrequent transaction from masking delays in a large data export or a recurring integration failure.