

How is managed cloud IT service performance measured?
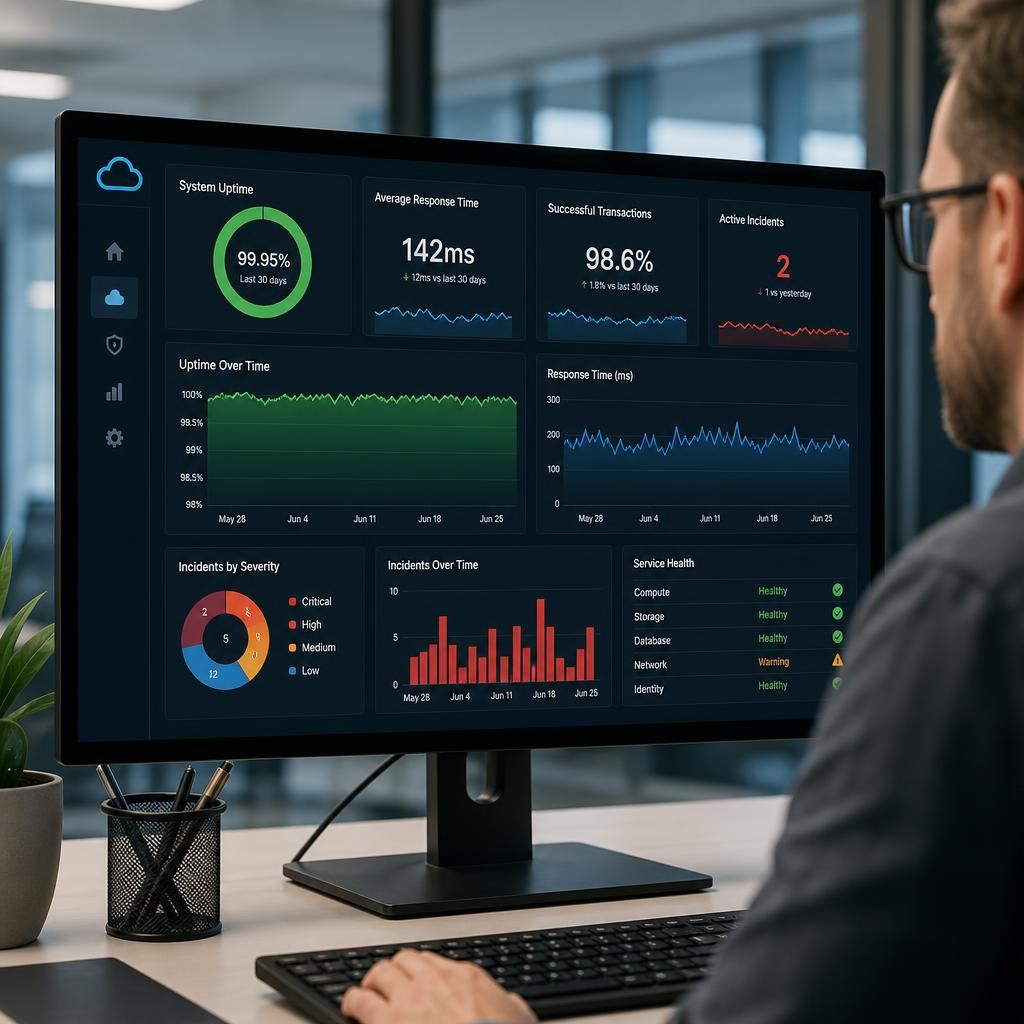
Managed cloud IT service performance is measured using agreed indicators such as availability, application response times, network latency, incident resolution, capacity utilisation and security events. Reviewing these measures over time shows whether cloud services are reliable, efficient, secure and aligned with the organisation’s operational requirements.
Managed cloud IT service performance is measured by comparing agreed service objectives with observed technical data and business impact over defined reporting periods. A useful assessment combines cloud, application, user and support information rather than relying on one headline figure. This shows not only whether systems are functioning, but whether they are supporting staff and business processes effectively.
Measurement should begin with clearly defined objectives. Different workloads require different standards. A customer-facing application, file-sharing platform and internal development environment may have different business priorities, acceptable disruption levels and performance requirements. The service definition should therefore record:
- which systems and dependencies are included;
- which business processes each service supports;
- the expected quality of service for each workload;
- how measurements are collected and calculated;
- what thresholds trigger investigation or corrective action; and
- how exceptions, planned maintenance and third-party dependencies are treated.
Without these definitions, a report can contain accurate data but still give a misleading impression. For example, an average across all users could conceal poor performance for a particular site, application or group of staff.
Baseline measurements provide the point of comparison. A managed service provider can establish normal operating patterns for each important workload, including typical demand, transaction volumes, resource consumption and user activity. Results can then be compared with the baseline by day, week, season or business cycle. Trend analysis is often more useful than a single result because gradual degradation may indicate configuration drift, growing demand or an approaching capacity constraint.
Measurements should also reflect the experience of users. Technical systems can appear healthy while staff encounter failed transactions, slow-loading screens, authentication difficulties or interruptions between integrated applications. User-experience monitoring, service desk records and structured feedback help connect infrastructure data with the practical effect on employees. Where possible, reports should separate an isolated issue from a widespread service problem and identify which locations, devices, applications or user groups were affected.
Business relevance is assessed through outcome-based measures. Depending on the organisation, these may include the successful completion of key digital processes, the proportion of transactions requiring manual intervention, the time taken to fulfil technology-dependent tasks, or the number of recurring faults affecting a department. These measures should not replace technical monitoring; they provide context for deciding whether a technical variation actually matters to the organisation.
Reports commonly combine several forms of analysis:
- Point-in-time results: what happened during the reporting period.
- Trend results: whether performance is improving, stable or deteriorating.
- Threshold breaches: where an agreed service objective was not met.
- Impact analysis: which users, processes or sites were affected.
- Cause analysis: whether the issue arose from configuration, demand, a change, a dependency or an external provider.
- Corrective-action tracking: whether agreed improvements have been completed and whether they produced the intended result.
The way data is summarised matters. Averages can hide short but severe problems, so reports may also use maximum values, minimum values, distributions or high-percentile results where these better represent user experience. Measurements should be consistent from one period to the next, with any changes to monitoring methods documented so that apparent improvements are not simply the result of altered data collection.
Performance management also includes change correlation. When a new configuration, application release, migration or integration is introduced, results before and after the change can be compared. This helps determine whether an alteration improved the service, had no material effect or introduced an unintended issue. Recording the time and scope of changes alongside monitoring data makes investigation more precise.
Cost efficiency can be reviewed alongside technical performance, particularly where cloud resources can scale or be configured in different ways. Useful analysis may compare resource consumption with workload demand and business usage. The aim is not to reduce consumption indiscriminately, but to identify unnecessary allocation, inefficient designs or growing demand that requires planning. Cost data should be considered with service quality so that apparent savings do not result from under-provisioning.
A good performance review ends with decisions, not merely a dashboard. Reports should identify material trends, explain exceptions, assign actions and record when the service objectives themselves need revising. Regular review between the organisation and its managed IT provider allows measures to remain aligned with changes to applications, staffing, locations, compliance requirements and business priorities. This turns performance measurement into an ongoing improvement process rather than a retrospective list of technical figures.
Reliable performance measurement depends on the quality and coverage of the monitoring data. A dashboard is useful only when it measures the relevant systems consistently and can distinguish genuine service conditions from gaps in monitoring, delayed data or collection errors.
Measurement controls should include:
- checking that critical cloud resources, applications, networks and dependencies are included;
- using consistent timestamps so events from different systems can be compared accurately;
- recording whether results come from continuous monitoring, scheduled tests, user activity or sampled data;
- retaining the underlying records needed to investigate an unusual result; and
- reconciling monitoring events with incident and change records before performance conclusions are drawn.
These controls help prevent misleading conclusions. For example, a service may appear stable if monitoring covers the cloud platform but not an integration or authentication service that users also depend on. Reviewing the source and completeness of the evidence is therefore an important part of measuring managed cloud IT service performance.
Discuss how to measure your managed cloud IT service performance
Speak to S2 Technology Group about defining a managed cloud IT performance measurement framework suited to your systems, workloads and business priorities. The discussion can establish which evidence and reporting arrangements are most useful for informed service reviews.